Disentangling Key Indicators for Patients' Mortality Rate in Intensive Care Units
Building machine learning models to predict in-hospital mortality.
 Image credit: unsplash
Since the digitalization of health records, the amount of electronic health records (EHRs) has been growing at an unprecedent rate. EHRs record comprehensive patient data comprising a wide variety of meansures including vital sign meansurements, input output values, patients’ clinical outcomes, medications, procedures, and laboratory test results. Thoughtful analyses and modelings based on the vast amount of high-resolution healthcare data can empower clinicians to access patients’ physical insights that were not available previously. In return, hospitals can provide more personalized and better treatments to patients.
Predicting patients’ in-hospital mortality is a area of active research. Accurate predictions of clinical outcome enables clinician to gauge patients condition and facilitate cost-effective management of hospital resources. Given the importance of this issue, In this project we are interested in using a large-scale, high-resolution MIMIC-III data to predict in-hospital mortality. We compare the performances of different machine learning models, including logistic regression, random forest, and neural networks. We are able to achieve 0.71 AUC score on the neural network model. Our results indicate that EHRs including MIMIC data have strong predictive power on in-hospital mortality. Factors such as the duration of ICU stay and white blood cell abnornal lab results are highly predictive of in-hospital mortality.
Data
The dataset MIMIC III (Medical Information Mart for Intensive Care) is used in our proejct. MIMIC III is a single-center database concerning patient admissions to critical care units. While full description can be found from physionet.org, the database incorprated several data sources, including:
- critical care information systems:
- Two different systems: Philips CareVue and iMDsoft MetaVision ICU. Most of data from the two systems was merged expect for fluid intake. The data that are not merged will be given a suffix to distinguish the data source, e.g. “CV” for CareVue and “MV” for MetaVision. These two systems provided clinical data including:
- physiological measurements, e.g. heart rate, arterial blood pressure, or respiratory rate;
- documented progress notes by care providers;
- drip medications and fluid balances.
- Two different systems: Philips CareVue and iMDsoft MetaVision ICU. Most of data from the two systems was merged expect for fluid intake. The data that are not merged will be given a suffix to distinguish the data source, e.g. “CV” for CareVue and “MV” for MetaVision. These two systems provided clinical data including:
- hospital electronic health records:
- patient demographics
- in-hospital mortality
- laboratory test results, including hematology, chemistry and microbiology results.
- discharge summaries
- reports of electrocardiogram and imaging studies.
- billing-related information such as International Classification of Disease, 9th Edition (ICD-9) codes, Diagnosis Related Group (DRG) codes, and Current Procedural Terminology (CPT) codes.
- Social Security Administration Death Master File.
- Out-of-hospital mortality dates
The data was cleaned so that the unit of observation is a given patient’s each ICU admission information. The features included are de-identitied patients' demographics information, such as age, gender, and ethnicity, proportion of abnormal lab results. We also constructed an indicator variable that indicates whether a patient has never been admitted to ICU.
Modeling
We constructed three machine learning model to predict the clinical outcome. Each model was trained and tuned on a training set, and the final model performance metrics were obtained on the test set. The table here shows evaluation metrics on different models.
| Logistics regression | Random Forest | MLP | |
|---|---|---|---|
| AUC | 0.62 | 0.63 | 0.71 |
| Accuracy | 0.90 | 0.92 | 0.92 |
| F1 | 0.36 | 0.40 | 0.55 |
| Precision | 0.56 | 0.86 | 0.71 |
| Recall | 0.26 | 0.26 | 0.44 |
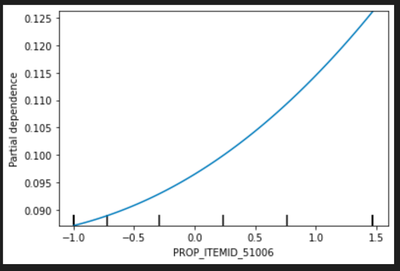
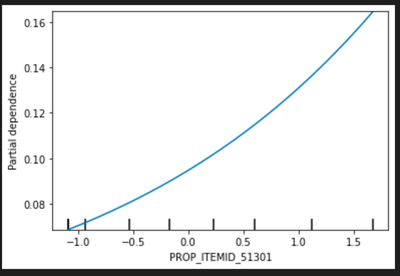
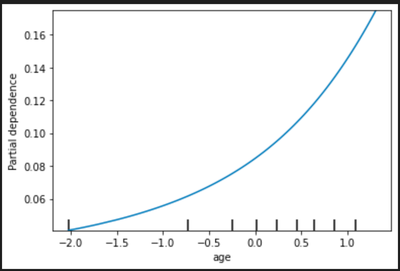
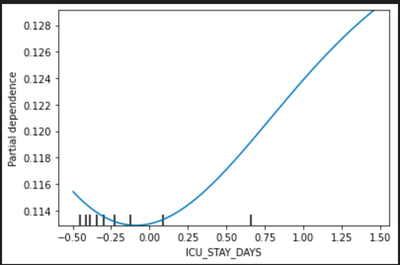
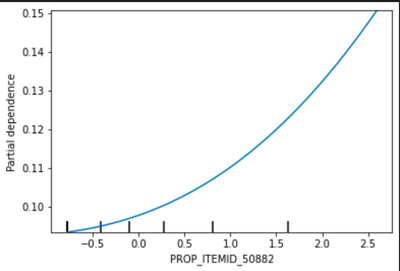
As we can see the MLP has the best AUC score across all three model. However, model interpretation on deep-learning based models is challenging, if not impossible. In order to gain insights into how some features impact the model predictions. We leveraged the feature importance score calculated from random forest. We selected top five most important features from the random forest model and plot the partial dependency plots on these five features to access the relationship between these features and in-hospital mortality probability.
Model Interpretation
We draw the partial dependency plot predicted from our random forest model to visualize the association between variable and our primary outcome. The top 5 important factors are listed below:
PROP_ITEMID_51006: proportion of abnormal test result in Urea Nitrogen Blood Chemistry
PROP_ITEMID_51301: proportion of abnormal test result in White Blood Cells Blood Hematology
Age: patients’ age
ICU_STAY_DAYS: patients’ length of ICU stays in days
PROP_ITEMID_50882: proportion of abnormal test result in Bicarbonate Blood Chemistry
In the partial dependency plot, 0 stands for the mean and the risk increases with the variables.
Refer to the complete code and notebook here!